
This tutorial demonstrates how to configure and use the Gantt Portlet in Novacura Flow Connect to visualize tasks, resources, dependencies, and project progress through an interactive timeline interface.
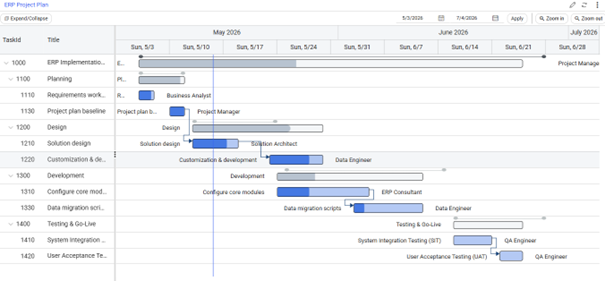
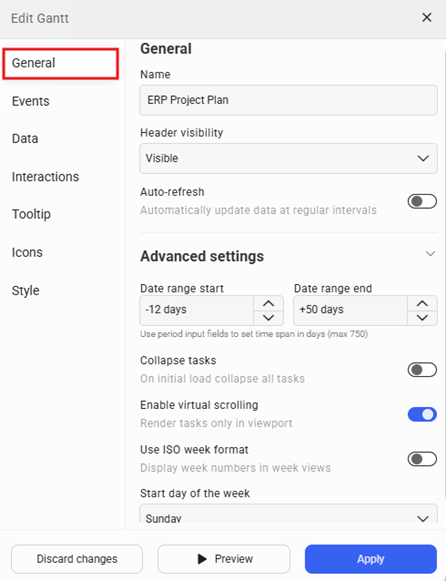
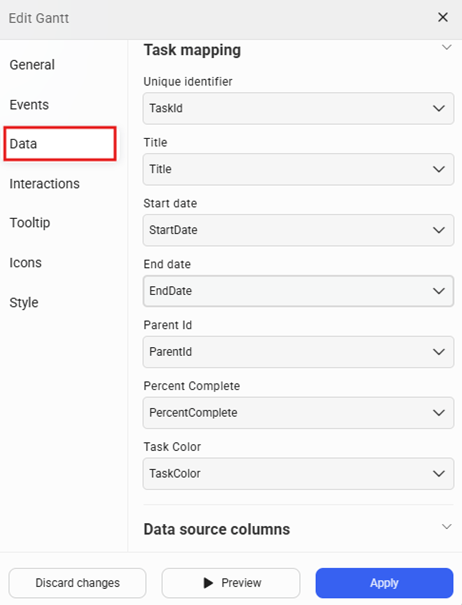
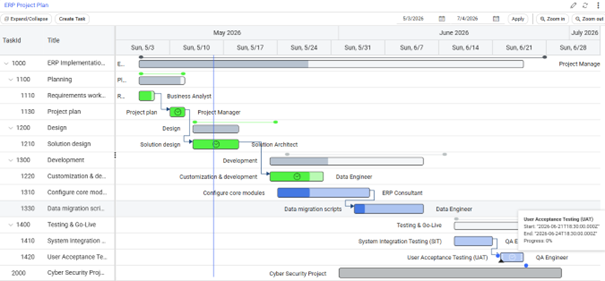
The tutorial guides users through the process of setting up a Gantt Portlet, connecting task, resource, and dependency data sources, and configuring timeline views that display project phases, milestones, and task progress. It demonstrates how to map task information, organize parent-child task hierarchies, assign resources, and visualize relationships between tasks.
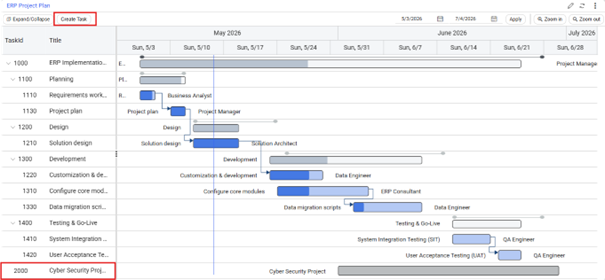
The tutorial also covers interactive project management features, including launching workflows through task double-click actions, editing tasks directly within the Gantt chart, updating progress, modifying task durations, moving tasks between hierarchy levels, and creating or updating task dependencies. Users will learn how to connect these interactions to Flow applications and components to support project maintenance and execution processes.
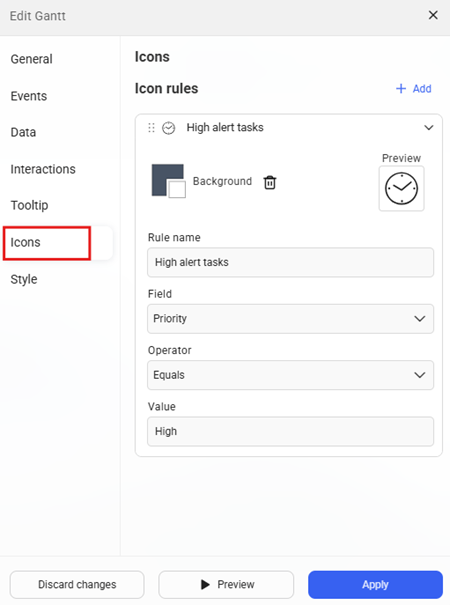
Additional visualization capabilities are explored, including custom action buttons, dynamic tooltips, rule-based icons, conditional styling, and performance optimization techniques for large task datasets. This tutorial is ideal for solution designers, developers, and project-focused teams who want to build interactive project planning solutions, visualize task schedules and dependencies, and create timeline-based experiences.
| App Type | Tutorial |
| Flow version | Connect |
| ERP Type | ERP independent |
| Process Area | Other process area |
| Library | Free Apps Standard Apps - Base |
| Product Clients | Web Client |
| Product Publisher | Novacura Business Apps |
| Publishing Date | 19.06.2026 |
| Powered by AI | No |
Want to see how this app works in your ERP environment? Request a demo and we’ll walk you through it.